
Overview:
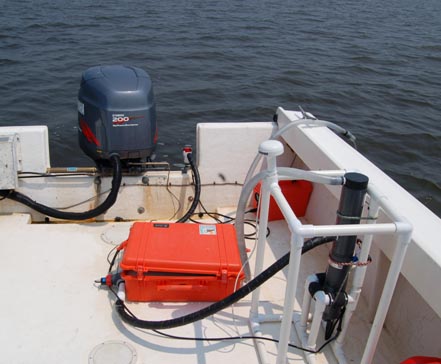
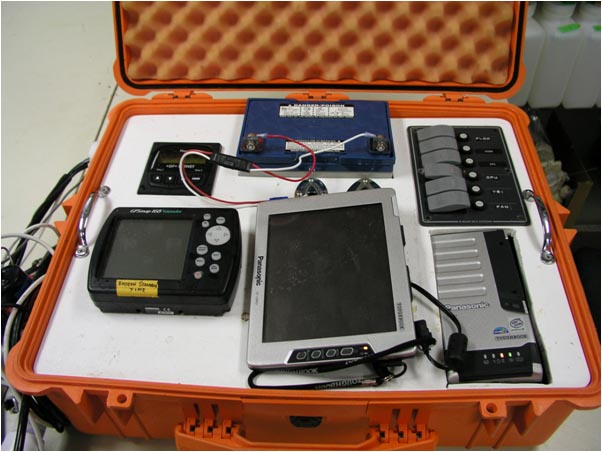
Shallow water habitat and water quality evaluation have become critical components of Chesapeake Bay monitoring. The Dataflow V High-Resolution Spatially Intensive Monitoring System represents a novel method to characterize shallow water ecosystems or rapidly classify hotspots to establish the boundaries of local disturbances. It also provides researchers and managers with a powerful tool to analyze and spatially describe the water quality and subsequent overall health of this critical shallow water habitat. The DataflowV sensor system represents a synthesis of new technologies that enables the researcher to combine discrete sample data produced by water quality sensors, and accurate spatial positioning and description utilizing the Global Positioning System.
Here at CBL we have improved the original Dataflow system, first developed by Madden and Day (1992), evolving the system into the current implementation, Dataflow V. This sensor suite provides for characterization of the surface waters of a tributary over a four-hour research cruise. The DataflowV system possesses the flexibility to quickly characterize a tributary system, or focus on trouble spots within the estuary. As an example of the latter, Dataflow V may reveal pockets of pronounced turbidity or algal blooms localized within an accuracy of ten meters. The system logs discrete samples every four seconds, and over 5000 data points can be collected during a single cruise. These datapoints are processed using interpolation software and can be used to produce a contour map of a target tributary for a particular parameter, such as the concentration of chlorophyll (which reveals the amount of phytoplankton), turbidity (water clarity, or concentration of suspended matter), or any number of water quality values scientists use to evaluate the health of Chesapeake Bay.
Publications:
Barnes, J. and Boynton, W.R., 2008. Water Quality Monitoring Program for the Mill Creek Sub-Estuarine System Located in Southern Calvert County, Maryland: Final Report. University of Maryland Center for Environmental Science, Technical Report No. TS-578-09.
Anderson, J., Barnes, J., and Boynton, W.R., 2007. Water Quality Monitoring Program for Mill Creek and its Tributaries Located in Southern Calvert County: Final Report. University of Maryland Center for Environmental Science, Technical Report No. TS-524-07.
Fisher, T.R., Hagy, J.D., Boynton, W.R., Williams, M.R., 2005. Cultural eutrophication in the Choptank and Patuxent estuaries of Chesapeake Bay. Limnology and Oceanography 51: 435-447.
Kemp, W.M., Boynton, W.R., Adolf, J.E., Boesch, D.F., Boicourt, W.C., Brush, G., Cornwell, J.C., Fisher, T.R., Glibert, P.M., Hagy, J.D., Harding, L.W., Houde, E.D., Kimmel, D.G., Miller, W.D., Newell, R.I.E., Roman, M.R., Smith, E.M., and Stevenson, J.C., 2005. Eutrophication of Chesapeake Bay: historical trends and ecological interactions. Marine Ecological Progress Series 303: 1-29.
Smail, P.W., Stankelis, R.M., Bailey, E.K., Boynton, W.R., Cammarata, J., Ceballos, M., 2005. Spatially intensive water quality monitoring of the Maryland Coastal Bays, April-November 2003. Technical Report Prepared for Maryland DNR. No. TS-467-o5.
Hagy, J.D., Boynton, W.R., Keefe, C.W., Wood, K.V., 2004. Hypoxia in Chesapeake Bay, 1950-2001: Long-term change in relation to nutrient loading and river flow. Estuaries 27: 634-658.
D'Elia, C.F., Boynton, W.R., Sanders, J.G., 2003. A watershed perspective on nutrient enrichment, science, and policy in the Patuxent River, Maryland: 1960-2000. Estuaries 26: 171-185.
Hagy, J.D., Boynton, W.R., and Sanford, L.P., 2000. Estimation of net physical transport and hydraulic residence times for a coastal plain estuary using box models. Estuaries 23(3): 328-340.
Boynton, W.R., 1998. Chesapeake Bay eutrophication: Current status, historical trends, nutrient limitation, and management actions, pp. 6-13. In: Proceedings, Coastal Nutrients Workshop, 30-31 October 1997. Australian Water and Wastewater Association Incorporated, Artamon, NSW, Australia.
Boynton, W.R., Murray, L., Hagy, J.D., Stokes, C., and Kemp, W.M., 1996. A comparative analysis of eutrophication patterns in a temperate coastal lagoon. Estuaries 19(2B): 408-421.
Maryland Department of Natural Resources,
Chesapeake Bay Water Quality Monitoring Program,
Ecosystem Processes Component (EPC):
Quality Assurance Plan for Water Quality Monitoring in Chesapeake Bay, FY2011.
Quality Assurance Plan for Water Quality Monitoring in Chesapeake Bay, FY2010.
Quality Assurance Plan for Water Quality Monitoring in Chesapeake Bay, FY2009.
Quality Assurance Plan for Water Quality Monitoring in Chesapeake Bay, FY2008.
Level 1 Interpretive Report No. 28, 2011.
To access the animations referred to in Chapter 4, 'Spatial Analysis of Water Quality Conditions,' p. 95 (4-8) and p. 122 (4-35), click each of the links below:
Bush River
Corsica River
Magothy River
Severn River
Level 1 Interpretive Report No. 32, 2015.
Level 1 Interpretive Report No. 31, 2014.
Level 1 Interpretive Report No. 30, 2013.
Level 1 Interpretive Report No. 29, 2012.
Level 1 Interpretive Report No. 28, 2011.
Level 1 Interpretive Report No. 27, 2010.
Level 1 Interpretive Report No. 26, 2009.
Level 1 Interpretive Report No. 25, 2008.
Level 1 Interpretive Report No. 24, 2007.
Level 1 Interpretive Report No. 23, 2006.
Level 1 Interpretive Report No. 22, 2005.
Level 1 Interpretive Report No. 21, 2004.
Level 1 Interpretive Report No. 20, 2003.
Level 1 Interpretive Report No. 19, 2002.
Level 1 Interpretive Report No. 18, 2001.
Level 1 Interpretive Report No. 17, 2000.
Level 1 Interpretive Report No. 16, 1999.
Level 1 Interpretive Report No. 15, 1998.
Level 1 Interpretive Report No. 14, 1997.
Level 1 Interpretive Report No. 13, 1996.
Level 1 Interpretive Report No. 12, 1995.
Level 1 Interpretive Report No. 11, 1994.
Level 1 Interpretive Report No. 10, 1993.
Level 1 Interpretive Report No. 9, 1992.
Level 1 Interpretive Report No. 8, 1991.
Level 1 Interpretive Report No. 7, 1990.
Level 1 Interpretive Report No. 6, 1989.
Level 1 Interpretive Report No. 5, 1988.
Level 1 Interpretive Report No. 4, 1988.
Level 1 Data and Interpretive Report No. 3, 1986.
Level 1 Data and Interpretive Report No. 2, 1985.
Level 1 Data and Interpretive Report No. 1, 1984.